Daniel Dunn, Nereus Senior Research Fellow in the Marine Geospatial Ecology Lab at Duke University, has published a paper on how environmental conditions and oceanic fronts promote seamount, underwater mountain, productivity. “A perspective on the importance of oceanic fronts in promoting aggregation of visitors to seamounts” (PDF) was published in Fish and Fisheries.
Abstract:
Recent evidence has demonstrated that not all seamounts are areas where productivity, biomass and biodiversity of marine life thrive. Therefore, understanding the drivers and mechanisms underlying seamount productivity is a major challenge in today’s seamount research. Incorporating oceanographic data in future analyses has been suggested to be of paramount importance to unveil many of the seamount ecology paradigms. Persistent hydrographic features, such as oceanic fronts, have been recognized to enhance biological activity and to drive marine animal distributions and migration patterns. However, the importance of oceanic fronts in driving aggregations of visiting animals on seamounts has not been understood yet. Here, we analysed a data set of seamounts in the Pacific Ocean alongside satellite-derived maps of strong, persistent and frequently occurring oceanographic features, to evaluate if oceanic fronts promote aggregation of visitors on seamounts. Our analyses suggest that seamounts with a higher front frequency were more likely to aggregate tuna catch than average seamounts. However, it appears that fronts may be driving factors for aggregation only if present above a certain threshold. These results highlight the importance of environmental conditions in general, and oceanic fronts in particular, in promoting seamount productivity. We therefore argue that a thorough examination of the oceanographic conditions promoting seamount productivity at various temporal and spatial scales is warranted in future seamount research agendas.
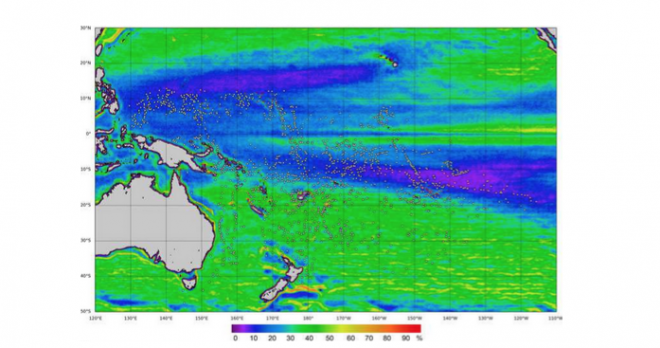
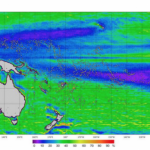
Figure 1. Thermal ocean front frequency map for the study area from 2006 to 2012 (percentage of time for which a strong front was observed, based on 8-day periods). White dots represent the location of seamount considered in this study, and the colour scale bar represents front frequency.
READ MORE: Daniel Dunn, ecosystems, biodiversity