


“Spatial differentiation of marine eutrophication damage indicators based on species density” was recently published in Ecological Indicators, co-authored by Nereus Alumnus Miranda Jones (UNEP-WCMC) and Nereus Director of Science William Cheung. The paper looks at developing an index to assess eutrophication effects on marine ecosystems and introducing an ecosystem response indicator to nitrogen loadings to coastal waters.
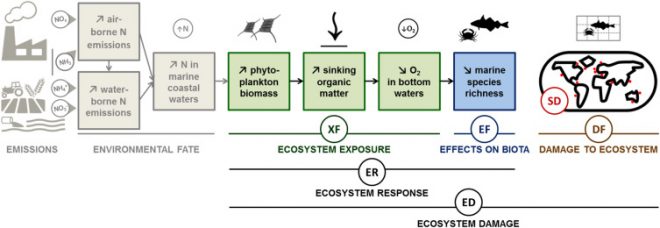
Fig. 1. Schematic representation of the marine eutrophication impact pathway. Cosme, N., et al., Spatial differentiation of marine eutrophication damage indicators based on species density. Ecol. Indicat. (2016), http://dx.doi.org/10.1016/j.ecolind.2016.10.026
Abstract
Marine eutrophication refers to an ecosystem response to the loading of nutrients, typically nitrogen (N), to coastal waters where several impacts may occur. The increase of planktonic growth due to N-enrichment fuels the organic carbon cycles and may lead to excessive oxygen depletion in benthic waters. Such hypoxic conditions may cause severe effects on exposed ecological communities. The biologic processes that determine production, sink, and aerobic respiration of organic material, as a function of available N, are coupled with the sensitivity of demersal species to hypoxia to derive an indicator of the Ecosystem Response (ER) to N-uptake. The loss of species richness expressed by the ER is further modelled to a marine eutrophication Ecosystem Damage (meED) indicator, as an absolute metric of time integrated number of species disappeared (species yr), by applying a newly-proposed and spatially-explicit factor based on species density (SD). The meED indicator is calculated for 66 Large Marine Ecosystems and ranges from 1.6 × 10⁻¹² species kgN−1 in the Central Arctic Ocean, to 4.8 × 10⁻⁸ species kgN−1 in the Northeast U.S. Continental Shelf. The spatially explicit SDs contribute to the environmental relevance of meED scores and to the harmonisation of marine eutrophication impacts with other ecosystem-damage Life Cycle Impact Assessment (LCIA) indicators. The novel features improve current methodologies and support the adoption of the meED indicator in LCIA for the characterization of anthropogenic-N emissions and thus contributing to the sustainability assessment of human activities.
Related Posts
 Sustainable management of the high seas could recoup fish stock losses due to climate change
 Nereus Report: Predicting Future Oceans — Climate Change, Oceans & Fisheries
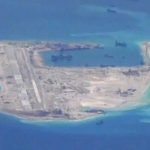 Instability in the South China Sea: Ecosystem challenges and political complexities
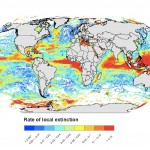 Where do we go from here? Building confidence in climate change impact projection models

